현재 사용 중인 언어로는 이 페이지를 사용할 수 없습니다. Google Translate을 사용하여
자동 번역된 페이지
를 볼 수 있습니다. Renishaw에게는 이 서비스를 제공할 책임이 없으며 번역 결과를 저희가 확인하지도 않았습니다.
추가로 도움이 필요하시면
저희에게 연락해 주십시오.
What Raman spectroscopy can tell you
Raman spectroscopy can tell us about the vibrational modes in a molecule or crystal. We can use Raman spectra for chemical and structural characterisation.
You can interpret Raman spectra to identify chemicals and get structural information. Raman scattering results from the interaction of light with molecular vibrations. These vibrations are very sensitive to changes in chemistry and structure, so you can spot subtle differences in molecular environment. Generally, all materials produce Raman spectra, except for pure metals.
What is a Raman spectrum?
We graphically display the results of our Raman spectroscopy measurements as Raman spectra. The y-axis represents the intensity of the scattered light, while the x-axis represents the energy (frequency) of light. We are interested in the shift in frequency of the Raman-scattered light, so we plot the x-axis frequencies relative to that of the laser. We label the x-axis as the Raman shift (shown by the units cm-1).
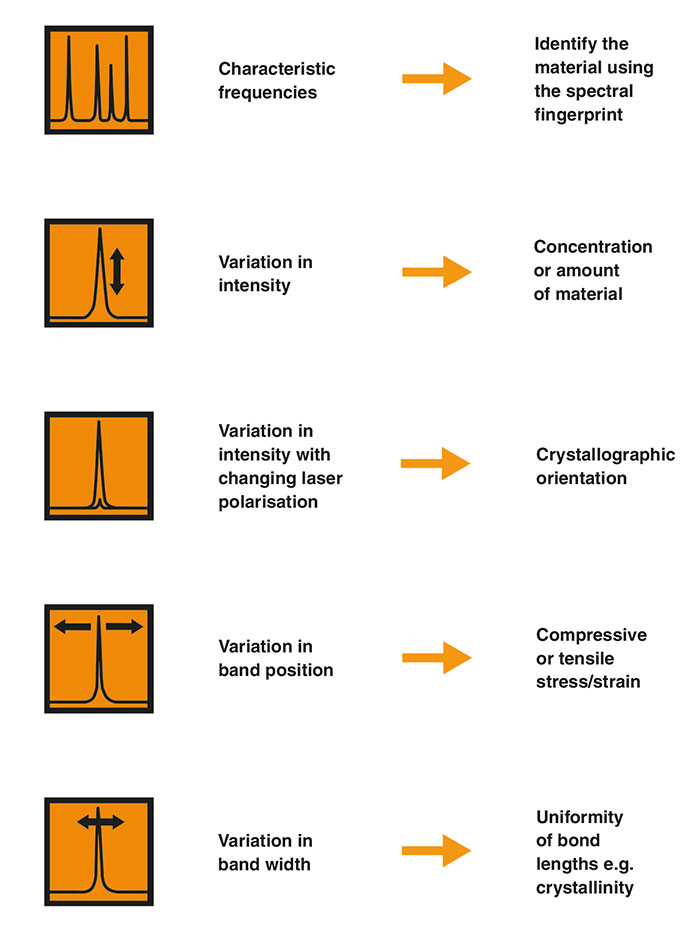
What information can I get from Raman spectroscopy?
Briefly, we use the features of the Raman spectrum in the following way:
- The Raman shifts and relative intensities of all the Raman bands of the sample
We can identify the sample using the spectral fingerprint. - Changes in the Raman spectra when varying orientation or polarisation
The intensities and positions of Raman bands can change with the relative orientation of the sample. We can show this by rotating the polarisation of the excitation laser and the collected Raman light. Using polarised Raman spectroscopy, you can reveal the symmetry and orientation of anisotropic materials.
- Individual band changes
A Raman band may vary in shift (position), narrow or broaden (width), or vary in intensity (height). These changes can reveal compressive/tensile stresses in the sample, variations in crystallinity, and the amount of material respectively. - Variations in spectra at different positions on the sample
These can reveal non-uniformity (heterogeneity) of the material. You can analyse at discrete points, or systematically measure an array of points (enabling Raman imaging of composition, stress, crystallinity, etc.)
A Raman spectrum therefore consists of a number of bands, each associated with a vibrational mode. The spectrum is unique to the material and enables you to identify it. Some researchers aim to fully understand each Raman band and how it relates to vibrational modes. However, most analysts simply identify samples using a spectral library.
Key features of a Raman spectrum
Interpretation of the Raman spectrum
One way of understanding a Raman spectrum is to consider the molecular functional groups as distinct units. This makes it easy to interpret the Raman spectrum of crystals with a regular array of identical atoms, all in the same configuration. For example, diamond contains carbon atoms in a regular tetrahedral network. In these cases, you often see just one dominant Raman band because there is just one molecular environment of the crystal.
In contrast, the Raman spectrum of polystyrene is more complex. The molecule is less symmetric and has hydrogen atoms in addition to carbon atoms. There are also different bond types connecting the atoms.

Raman spectra of diamond and polystyrene. The Raman spectrum of polystrene is more complex than that of diamond due to differing bond types.
Characteristic vibrational frequencies of chemical bonds
The frequencies of vibration depend on the masses of the atoms involved and the strength of the bonds between them. Heavy atoms and weak bonds have low Raman shifts. Light atoms and strong bonds have high Raman shifts.
In the polystyrene spectrum, we see the high frequency carbon-hydrogen (C-H) vibrations at about 3000 cm-1. The low frequency carbon-carbon (C-C) vibrations are at around 800 cm-1. The C-H vibrations have a higher frequency than the C-C vibrations because hydrogen is lighter than carbon.
Similarly, we see the vibrations of two carbon atoms linked by strong double bonds (C=C) at around 1600 cm-1. This is at a higher frequency than two carbon atoms linked by a weaker single bond (C-C, 800 cm-1).
You can use these simple rules to explain many of the features of Raman spectra.
Raman shifts are sensitive to neighbouring bonds
You can see more subtle effects if you inspect Raman spectra closely. For example, the C-H vibrations of polystyrene appear in two bands, at approximately 2900 cm-1 and 3050 cm-1. The carbons in the former band are part of aliphatic carbon chains, whereas the carbons in the latter band form part of aromatic carbon rings.
You can view the vibrations of a complex molecule as partly consisting of many simple diatomic vibrations. However, you should also consider the vibrations of larger groups of atoms to get a full understanding of the Raman spectrum. For example, the Raman spectrum of polystyrene has a band at 1000 cm-1. This is due to the expanding and contracting ‘breathing mode' of the aromatic carbon ring in polystyrene.
Low-frequency Raman bands
You can also study molecular vibrational and rotational modes with low-frequency Raman shifts, below 100 cm-1. These originate from very heavy atoms or very large-scale vibrations, such as the whole crystal lattice vibrating. Renishaw's Raman instruments enable you to study these modes. You can explore a wide range of materials and crystals, easily distinguishing between different crystalline forms (polymorphs) and layered structures.
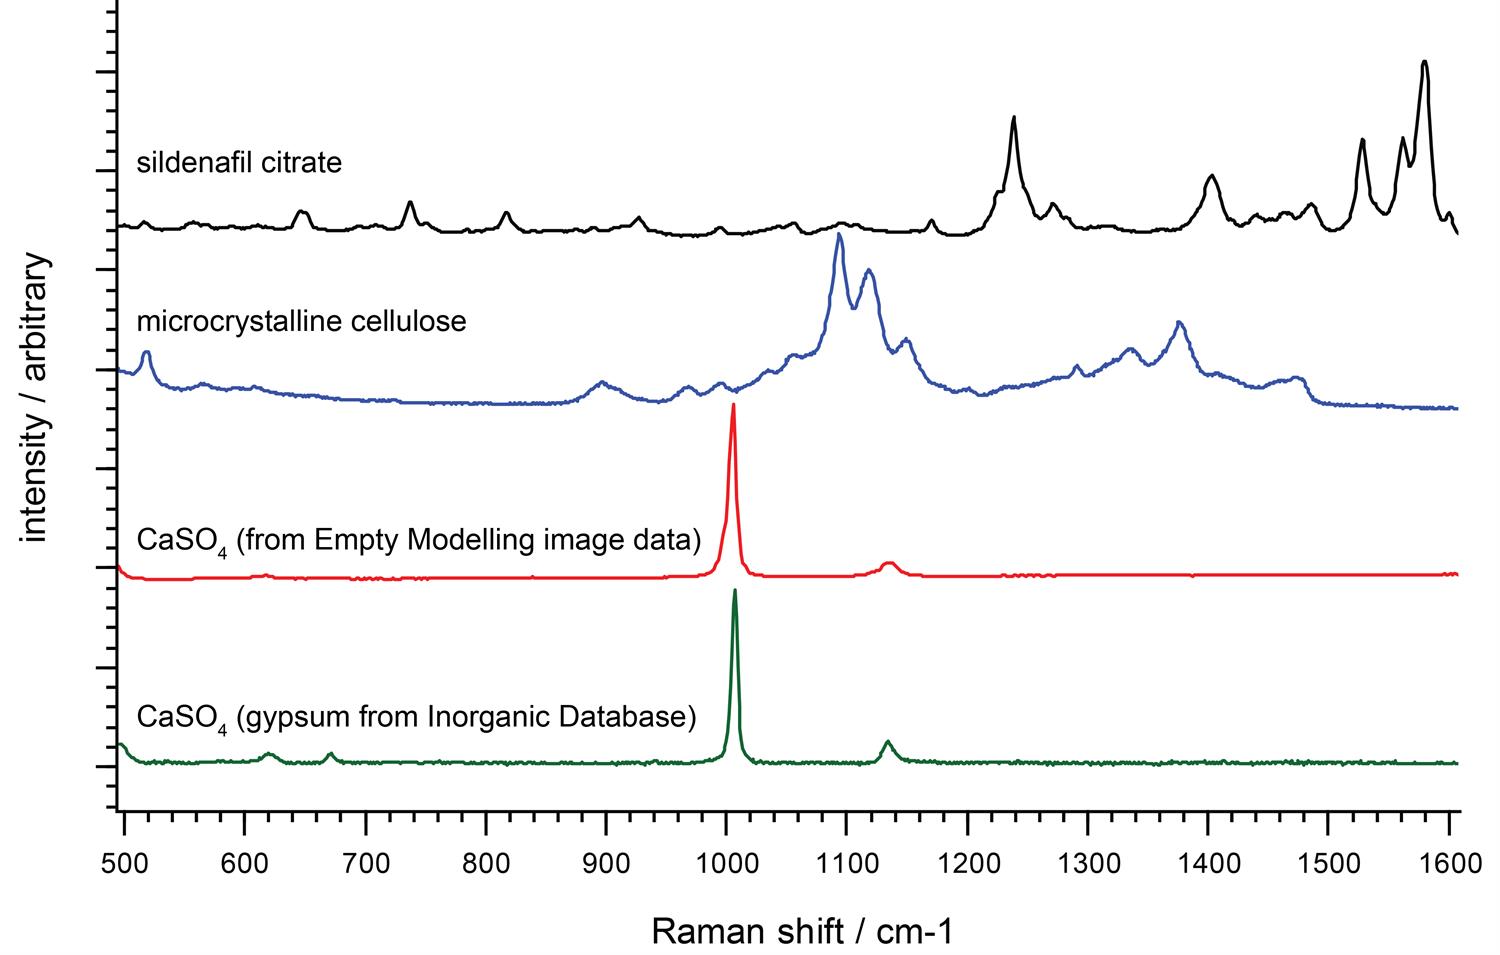
How can Raman spectroscopy identify materials?
We can identify unknown materials from their unique Raman spectral fingerprints, typically using software searches of spectral libraries. We use the Raman bands in the fingerprint region (from 300 cm-1 to 1900 cm-1) to identify molecules.
Ideally, you would use a Raman instrument with high spectral resolution across the whole Raman range. This gives you better chemical specificity. You can then identify, differentiate and investigate a wider range of materials.
Raman spectroscopy explained
New to Raman spectroscopy? Get started quickly with the fundamentals of Raman analysis.
Understanding crystallinity and polymorphism with Raman spectroscopy
You can study differences in material structure by comparing their Raman spectra. You could quantify the degree of crystallinity and distinguish similar crystal forms (polymorphism) of the same chemical. To do this, you would need a Raman spectrometer with high spectral resolution, such as an inVia™ confocal Raman microscope.
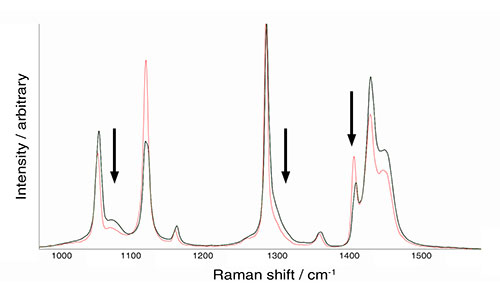
Raman spectra of two polyethylene samples showing differences in intensities and band widths. These spectral differences are due to varying degrees of crystallinity.
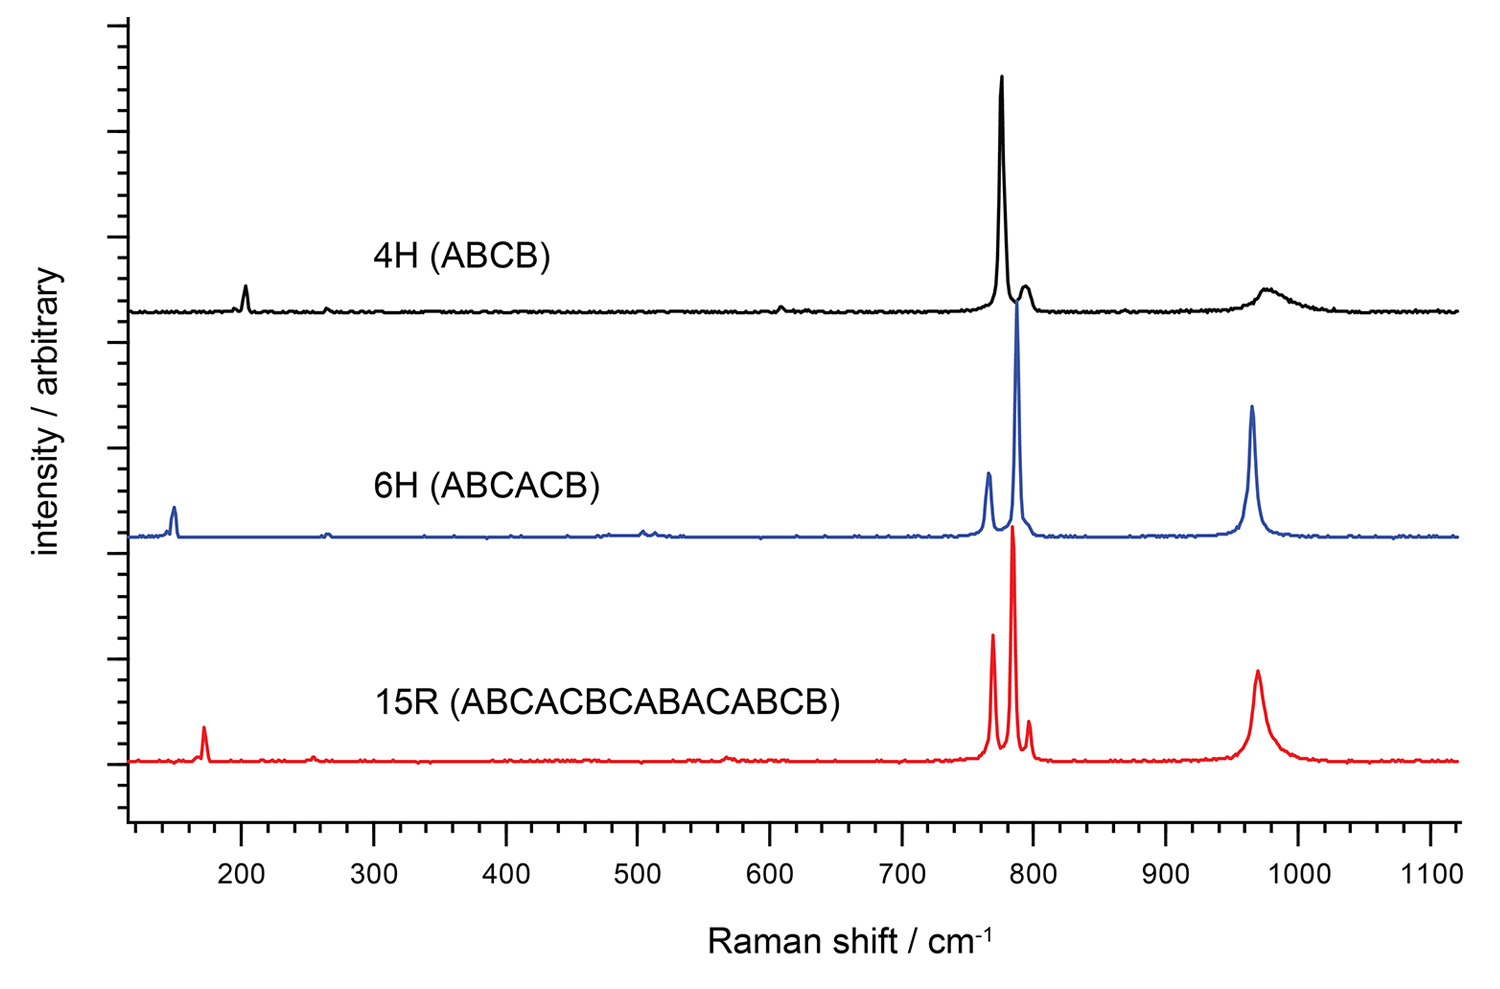
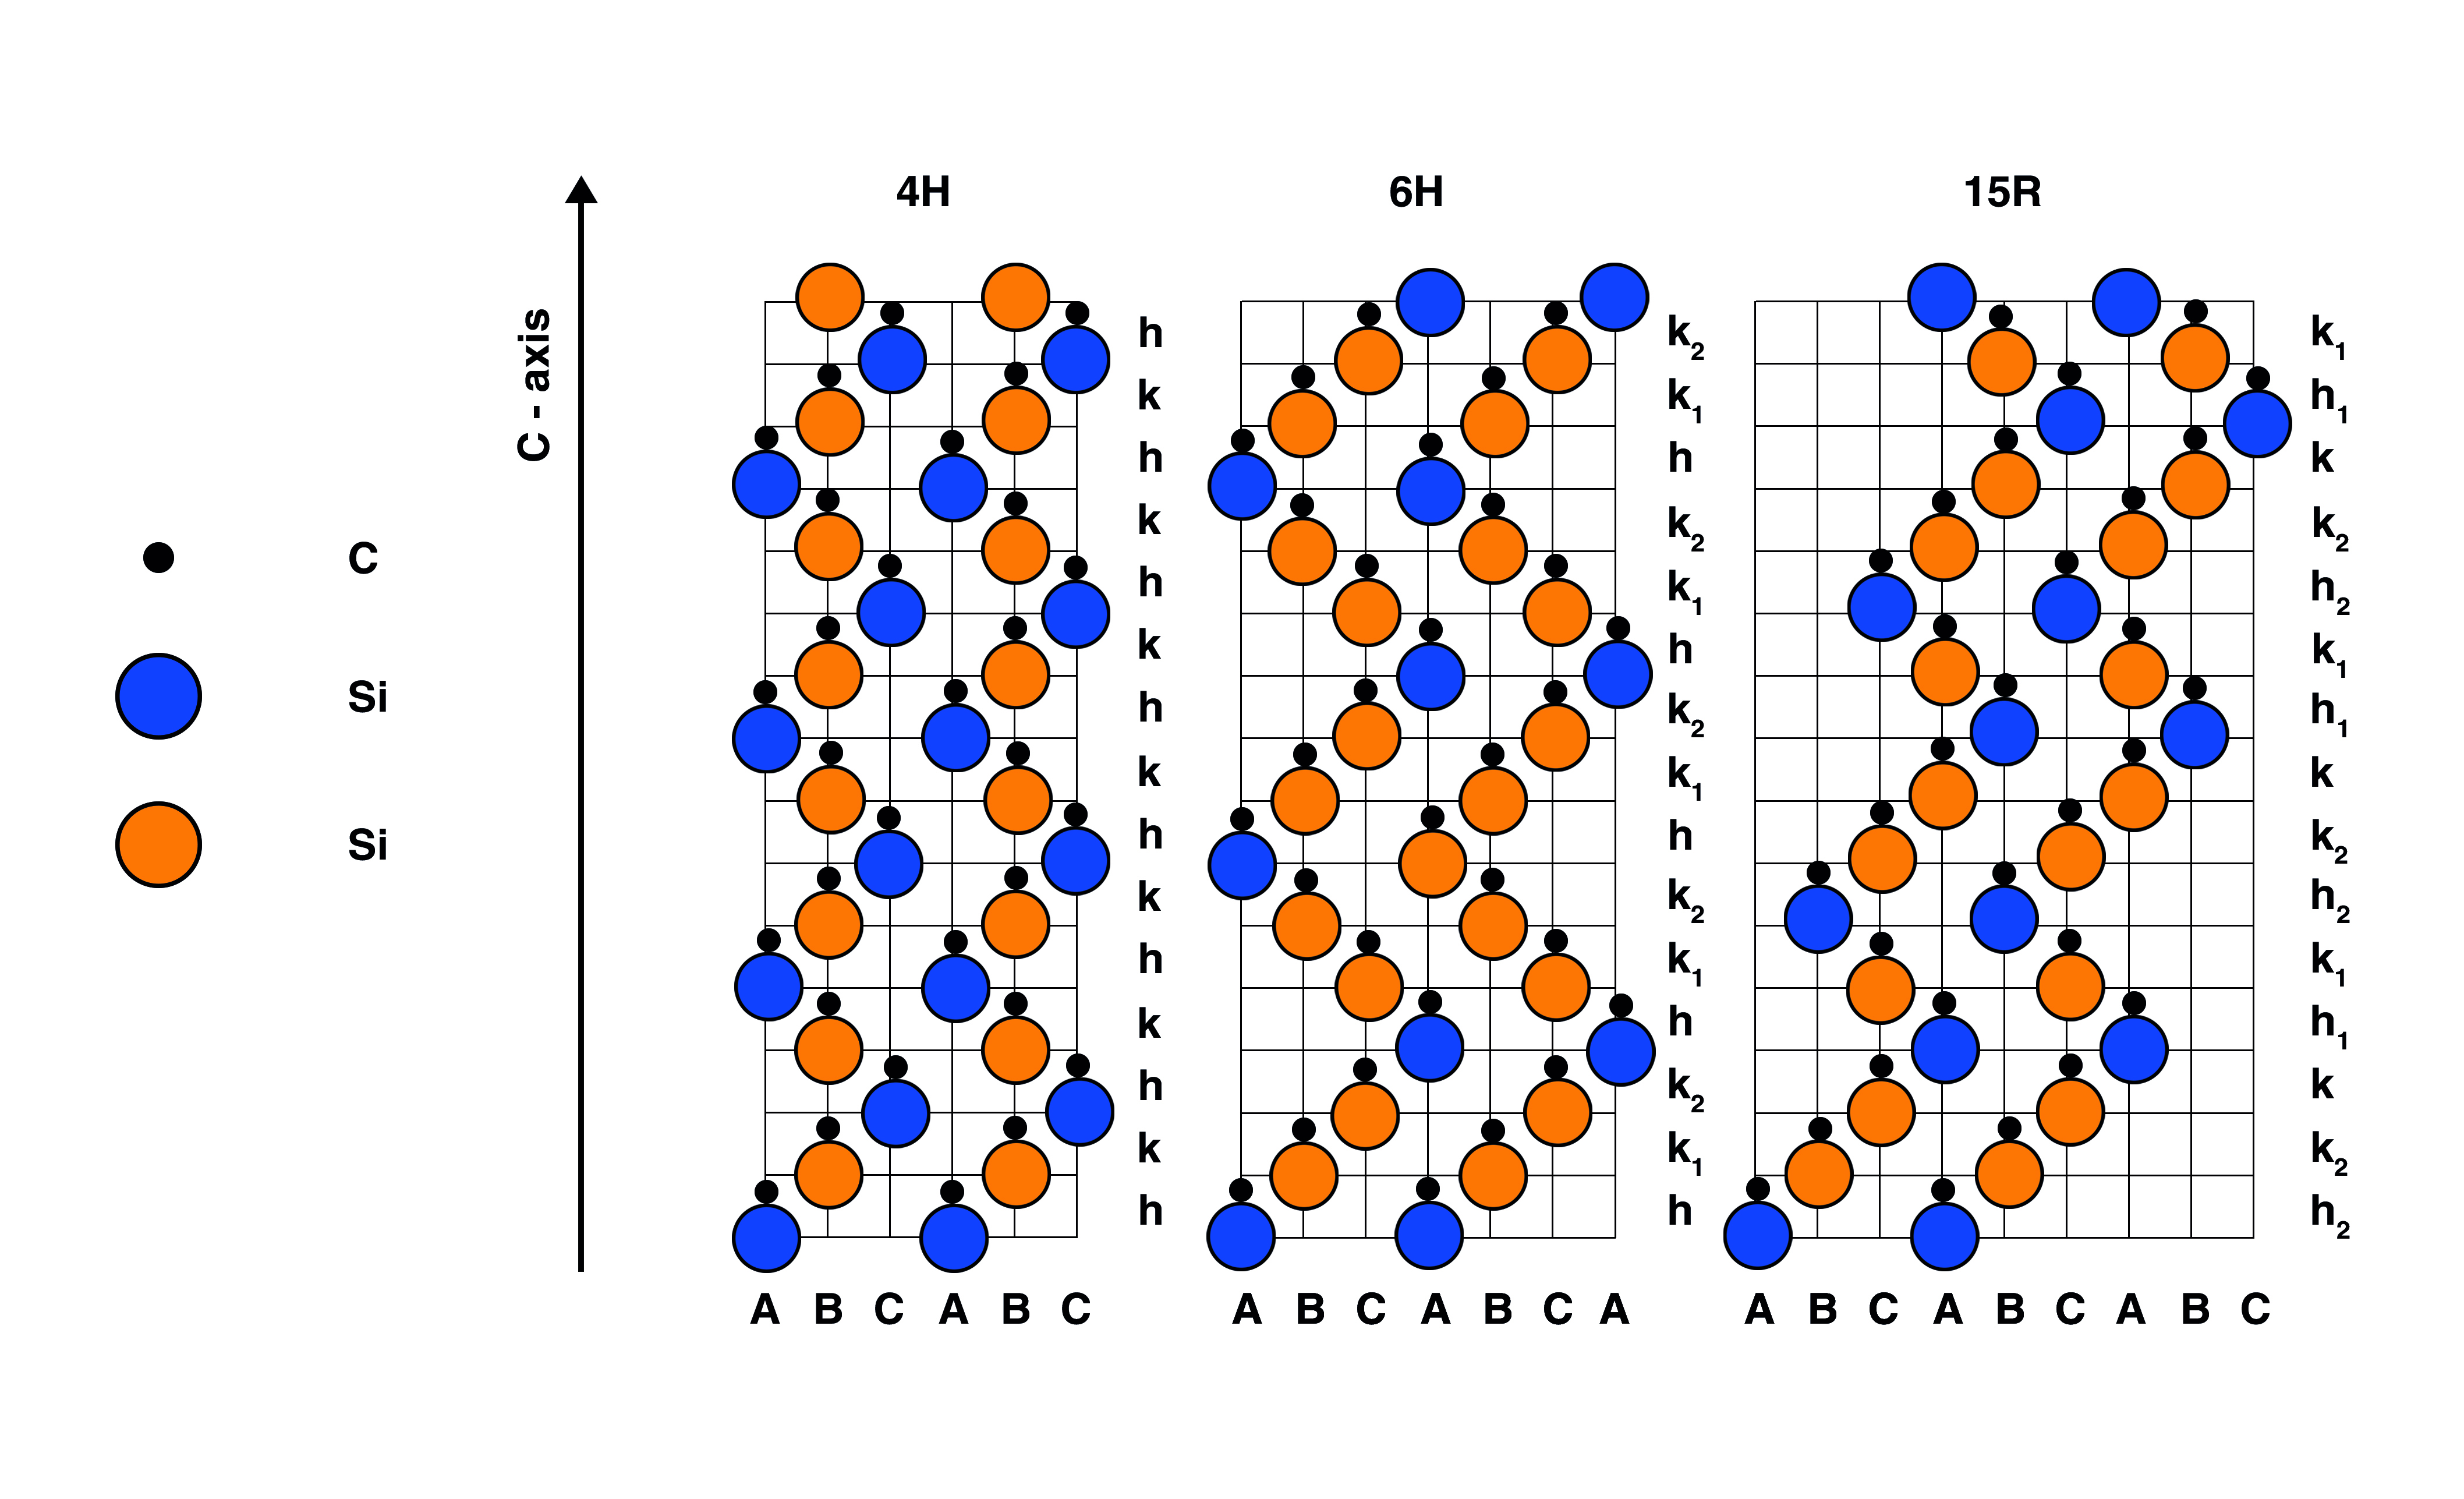
Left: Spectra of three different polymorphs of silicon carbide (SiC), an important semiconductor material.
Right: Crystal structure of SiC polymorphs: 4H-SiC; 6H-SiC and 15R-SiC.
Raman spectroscopy can easily differentiate between the 4H, 6H and 15R polymorphs of SiC. The controlled fabrication of SiC polymorphs is important for industrial semiconductor applications.
What is Raman spectroscopy?
Continue your exploration of Raman and photoluminescence (PL) spectroscopy. We answer your questions on Raman microscopy, fast Raman imaging, data analysis, fluorescence and complementary analytical techniques.
Raman spectroscopy explained